Simple Guide to Creating Effective Histograms: Essential Steps for 2025 Success
Histograms are essential graphical representations used in statistics for displaying the distribution of numerical data. This visual tool allows analysts and researchers to understand data trends and frequencies easily. In this guide, we’ll explore effective techniques for making a histogram, ensuring you can present your data clearly and effectively, whether you’re working with Excel, R, or other statistical software.
Understanding how to create a histogram is crucial for anyone involved in data analysis, whether you’re a student, researcher, or professional. From learning the significance of histogram binning to understanding the interpretation of histogram shapes, this guide will provide you with a comprehensive overview of the topic.
We’ll also touch on various histogram types, their applications, and the best practices to follow to effectively convey your data insights. By the end of this article, you’ll have the tools you need to create insightful histograms that enhance your data presentation and analysis.

Key Concepts in Histogram Visualization
To effectively create a histogram, it’s essential to grasp some fundamental concepts of histogram visualization. Building a histogram begins with defining key terms and understanding its various components. Knowing the primary histogram definition will lay a solid foundation for further exploration.
Understanding the Histogram Definition
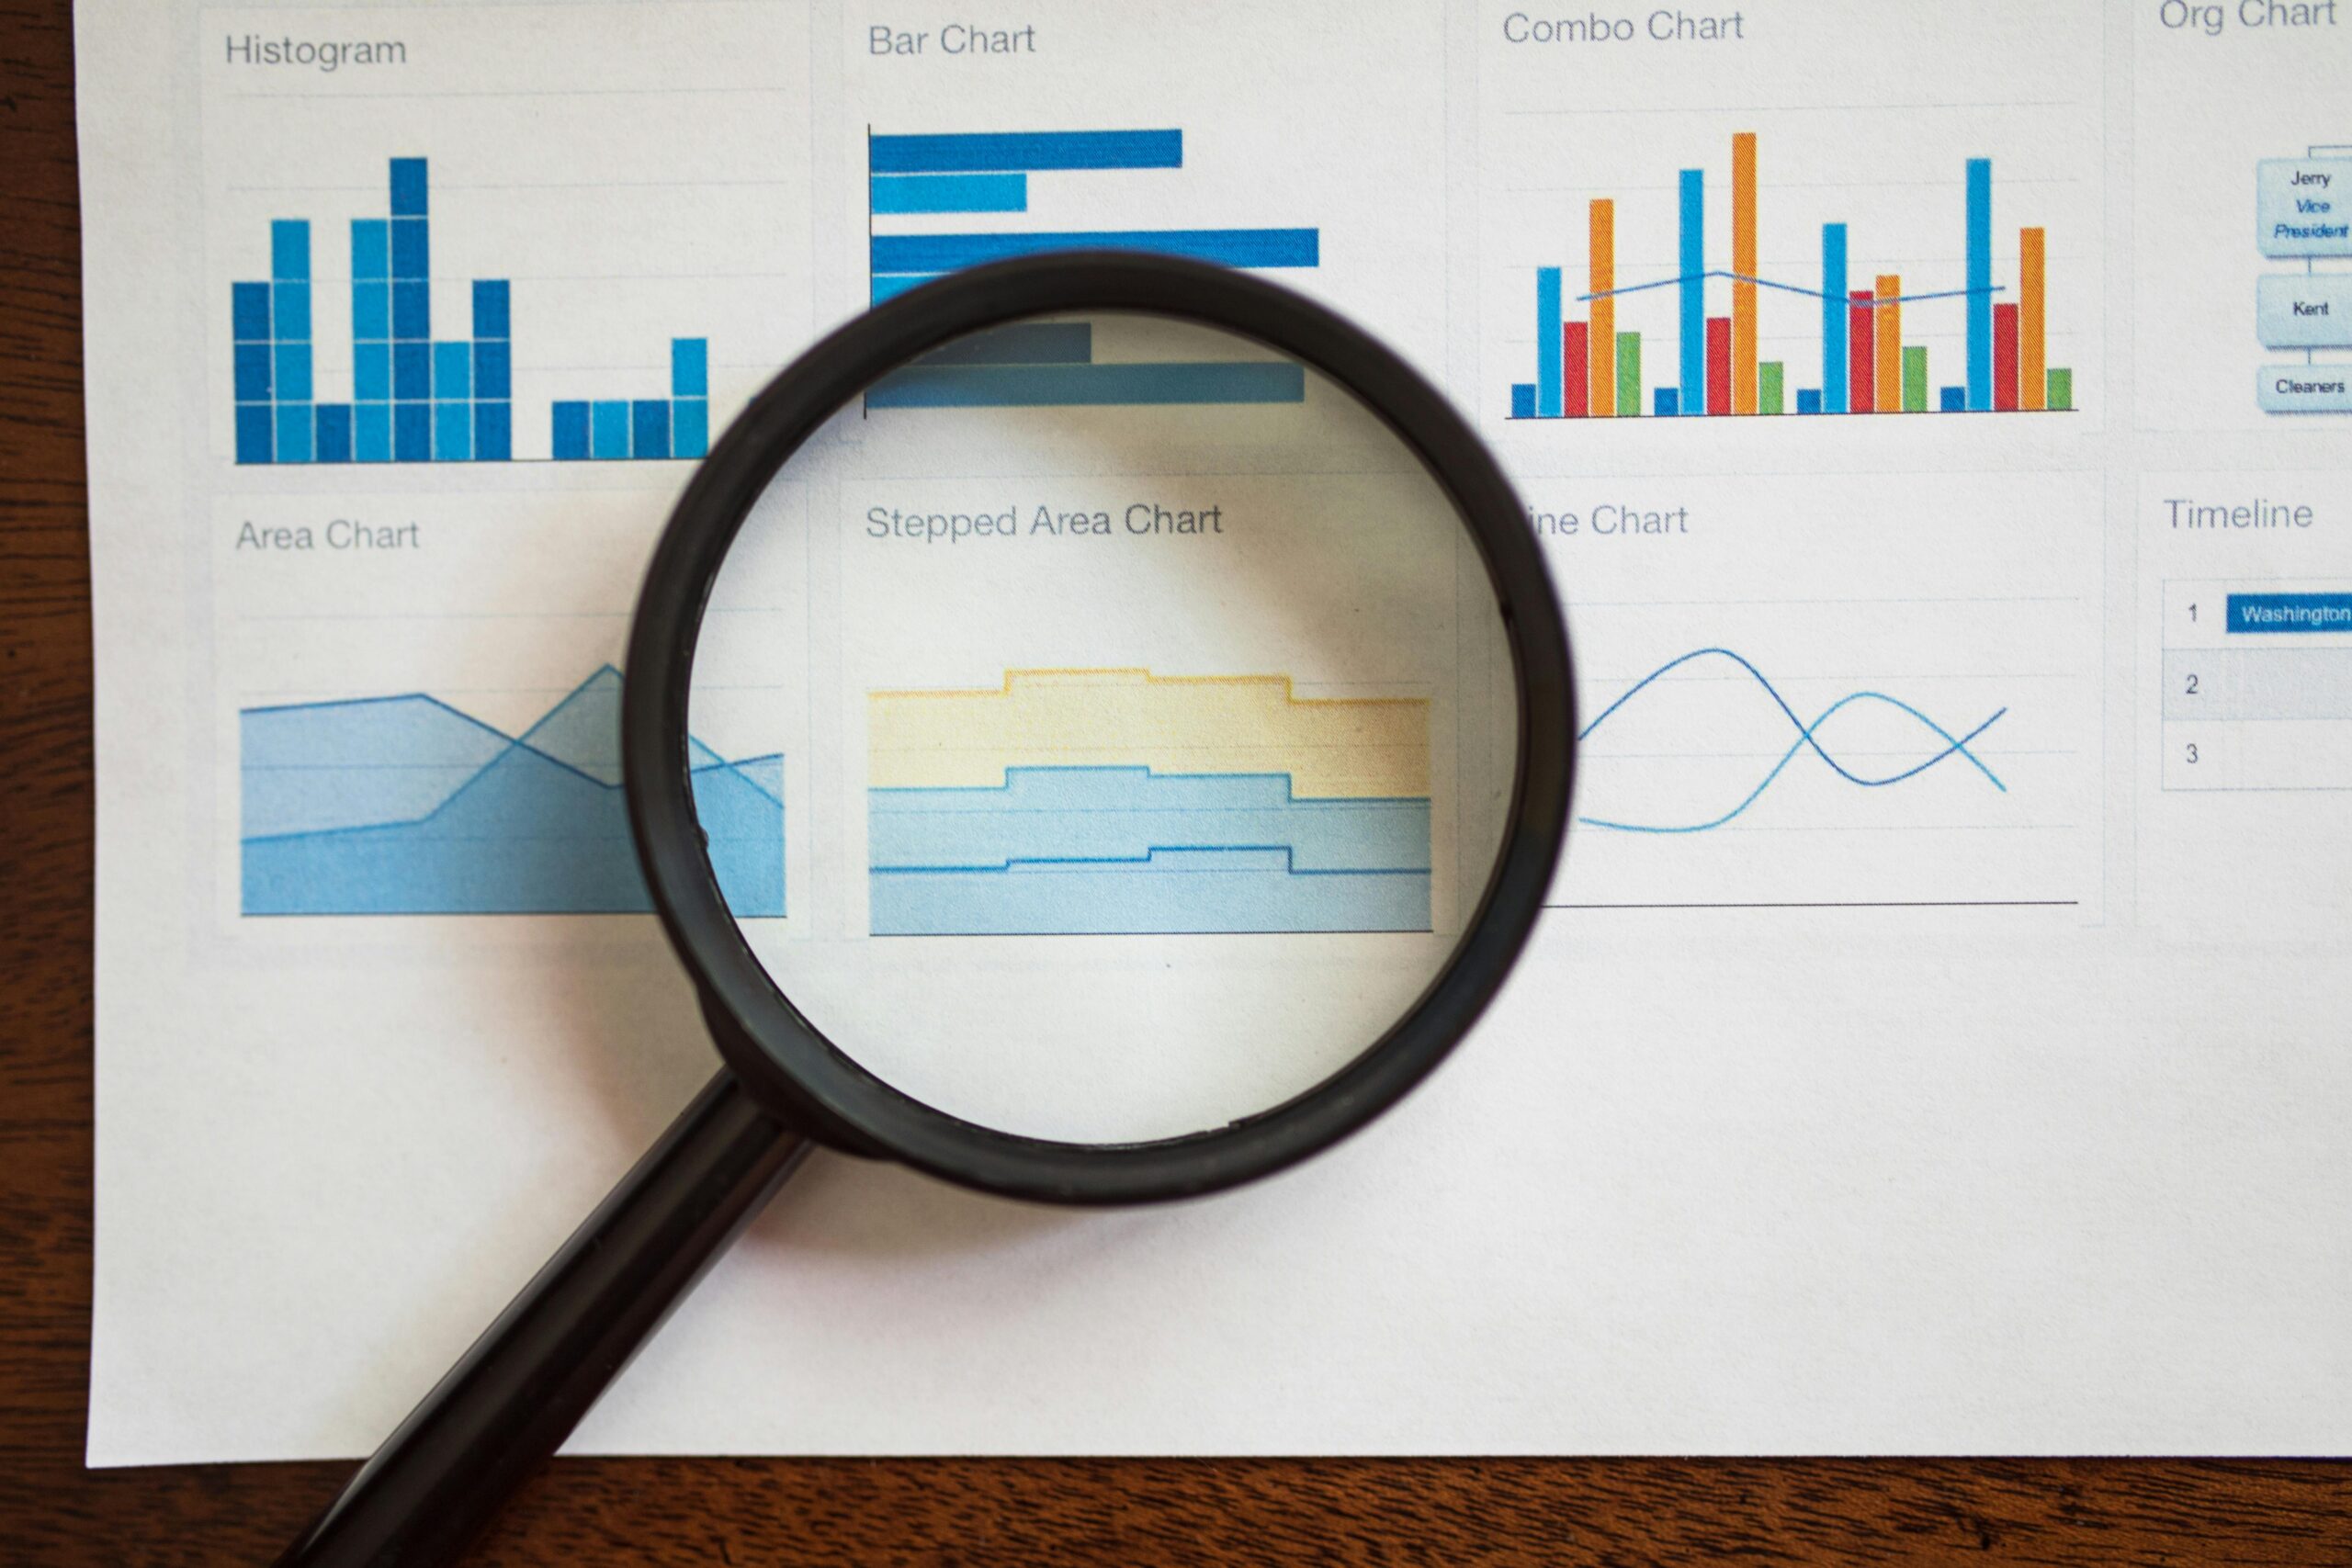
A histogram is a type of bar graph that represents the frequency distribution of numerical data. Each bar in a histogram corresponds to a range of values, known as bins, and the height of the bar indicates how many data points fall within that range. This type of graph provides a visual summary of the data, allowing you to see patterns and trends in your data distribution quickly.
Importance of Histogram Analysis
Histograms are invaluable for data analysis. They allow you to identify the central tendency, dispersion, and shape of data distributions. Using a histogram facilitates a better understanding of data characteristics such as normality, skewness, and kurtosis, which are critical in statistical research and interpretation.
Frequency Distribution and Histogram Characteristics
The frequency distribution is integral to creating a histogram. By categorizing your data into distinct bins, you can generate an organized view of how often each data point occurs. Understanding histogram characteristics, such as the effects of bin width and range, can affect your analysis significantly. The right choice of bin width can reveal hidden patterns or obscure important information, so select wisely based on your data’s nature.
Steps to Create a Histogram Using Different Tools
With the foundational concepts in mind, let’s explore the effective steps to create histograms using various popular tools. This section will cover how to build a histogram in software like Excel and R, which are widely used in statistical analysis.
Creating a Histogram in Excel
Excel is a powerful tool for data visualization, and creating a histogram in Excel involves just a few steps:
- Prepare your data in a single column.
- Select the data and navigate to the “Insert” tab.
- Click on “Insert Statistic Chart” and choose “Histogram.”
- Adjust the bin width and other formatting options as necessary.
Once created, you can customize your histogram by changing the design and layout to enhance clarity and visual appeal.
Building a Histogram in R
If you prefer programming, building a histogram in R is straightforward. Here’s a quick guide:
# Sample Code to create a histogram in R
data <- c(1, 2, 3, 4, 6, 6, 7, 8, 9, 10)
hist(data, breaks=5, main="Histogram Example", xlab="Data Values", ylab="Frequency")
This basic code will generate a histogram. You can further customize it using additional options in the hist function, like colors and labels, to match your analysis needs.
Using Specialized Histogram Software
For those who require advanced capabilities, specialized statistical software can enhance your histogram creation process. Tools like Tableau or statistical packages provide customizable options that improve data visualization. You can also find online histogram generators that allow you to input data directly and create visualizations effortlessly.
Common Mistakes to Avoid When Creating Histograms
While creating histograms, it’s easy to make mistakes. Understanding these common pitfalls will help you create more accurate and effective visualizations.
Choosing the Wrong Bin Size
One of the primary mistakes is selecting an inappropriate bin size, which can distort your data representation. If the bins are too wide, you may fail to capture significant details in your data distribution. Conversely, too narrow bins can lead to overly complex histograms with too much noise. Test different bin sizes to find the sweet spot that effectively conveys the data story.
Ineffective Data Grouping
Another frequent error is poor data grouping. For categories or continuous data, ensuring that data points are combined logically affects histogram clarity. Always group similar data points together to provide an accurate visual representation of frequency distribution.
Neglecting Data Insights
Finally, failing to analyze and interpret the histogram can limit your insights. Once you create a histogram, take the time to assess its shape and characteristics—such as skewness and modality—to derive meaningful conclusions about your data.
Interpreting Histogram Outputs
Now that we’ve covered creation techniques, let’s explore how to interpret histogram results effectively. The insights drawn from histograms can drive critical decisions in various analytical domains.
Understanding Histogram Shapes
Histogram shapes reveal vital information about distribution types. For example, a bell-shaped histogram indicates a normal distribution, while skewed shapes reveal biases in data, guiding further analysis and methods. Awareness of histogram shapes is essential for communicating findings effectively.
Comparison of Multiple Histograms
When comparing multiple histograms within the same dataset, visual differences can highlight variations among groups. This comparative analysis is particularly useful in research settings, allowing researchers to observe trends across categorical variances.
Cumulative Histograms for Deep Insights
A cumulative histogram provides an excellent method for representing data distribution, providing cumulative totals across data points. This visualization is beneficial for understanding how many observations fall below a particular value, guiding effective decision-making.

Practical Applications of Histograms
Understanding practical applications will help you to see the versatility of histograms across different fields, particularly in statistical and data-driven environments.
Histograms in Education
In educational settings, histograms help clearly convey academic performance distributions. Instructors can visualize grades, attendance, and test scores using histograms to derive actionable feedback and tailor classroom strategies.
Using Histograms in Business Analytics
Businesses leverage histograms to analyze customer preferences and sales distributions. Such statistical analysis can guide product development, marketing strategies, and performance evaluation, ensuring a data-driven business approach.
Histogram Applications in Research Methodologies
Histograms are a staple in research methodologies, providing the visual data needed for presentations and reports. Researchers can utilize robust histogram techniques to illustrate their findings clearly, ensuring that complex statistical information is accessible and comprehensible.
Frequently Asked Questions About Histograms
What is the primary purpose of a histogram?
The primary purpose of a histogram is to provide a graphical representation of numerical data distributions, facilitating data interpretation and insight extraction.
How do I determine the appropriate bin size for my data?
The appropriate bin size is determined by analyzing your data range and the number of data points you have. Generally, a good practice is to use Sturges’ formula or the square root of the number of observations to guide your selection.
Can histograms represent qualitative data?
While histograms are mainly used for quantitative data, related graphical methods, like bar charts, are more suitable for qualitative data representation.
How can I customize my histogram for better clarity?
You can customize your histogram by choosing meaningful labels, adjusting bin widths, modifying colors, and using clear titles to enhance comprehension.
Where can I find tools to create histograms easily?
Many online tools and software, such as Tableau, R, and Excel, provide options for creating histograms quickly and efficiently. You can refer to resources for a wide variety of functions and features.