Understanding Degrees of Freedom: A Practical Guide to Finding Them in 2025
What are Degrees of Freedom?
In statistics, **degrees of freedom** (df) refer to the number of independent values or quantities which can vary in an analysis without affecting the outcome. Understanding degrees of freedom is crucial in various statistical tests, including hypothesis testing, regression analysis, and ANOVA. A deeper grasp of these concepts will elevate your competence not just in basic statistical analysis, but also in advanced methodologies like machine learning and data science. In the following sections, we will explore how to find degrees of freedom, the **degrees of freedom formula**, and examples that clarify this essential concept.
Degrees of Freedom Explained
The **degrees of freedom** can be viewed as the number of values in a calculation that are free to vary. For example, when estimating a population’s mean from a sample, the degrees of freedom are determined by the sample size minus one (n-1). This is pivotal because it helps adjust for bias in estimation. When we mention the **degrees of freedom in regression**, it often refers to how many parameters can vary independently in relation to the number of observations.
Calculating Degrees of Freedom in Various Contexts
Different statistical tests have different methods for calculating degrees of freedom. In a chi-square test, for instance, the formula for degrees of freedom is (number of categories – 1). For an independent t-test or a paired t-test, df is calculated differently. For the t-test, the df is usually the total number of samples minus the number of groups. Similarly, in ANOVA, the **degrees of freedom for one-way ANOVA** is derived from the total number of observations minus the number of groups (n – k). Understanding the specific **degrees of freedom calculations in research** is necessary for accurate analysis.
The Importance of Degrees of Freedom
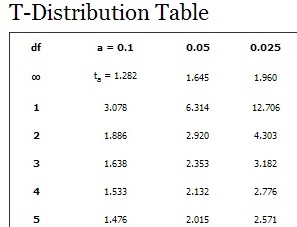
The concept of degrees of freedom greatly impacts the results of statistical tests. It dictates the shape of the sampling distribution in the t-distribution and influences the critical values for determining statistical significance. Having adequate degrees of freedom ensures robust statistical inferences and shapes our understanding of the data’s variability and significance levels. Statistical significance is inherently tied to degrees of freedom, making it a pivotal aspect in hypothesis testing.
Finding Degrees of Freedom in Specific Statistical Tests
Diving into specific statistical tests provides clarity on how to find degrees of freedom. There are distinct rules and methods for different scenarios, and understanding each can help in accurately interpreting results.
Degrees of Freedom for the t-Test
When calculating degrees of freedom for a **t-test**, there are two cases to consider: independent samples and paired samples. For independent samples, the formula is (n1 + n2 – 2), where n1 and n2 represent the sample sizes of each group. For paired samples, the calculation typically simplifies to (n – 1). As an example, if you’re testing the mean difference between two groups of 20 participants each, the degrees of freedom would be calculated as 20 + 20 – 2 = 38. This understanding of **degrees of freedom for paired samples** enables more accurate statistical conclusions.
Degrees of Freedom in Chi-Square Tests
In **chi-square tests**, calculating the degrees of freedom typically follows the formula (number of rows – 1) * (number of columns – 1) for contingency tables. For instance, if you have a 2×3 table, the degrees of freedom would be (2 – 1)(3 – 1) = 1 * 2 = 2. This metric allows researchers to assess the strength of the associations within their data, enhancing the overall utility of **finding degrees of freedom in chi-square tests**.
Degrees of Freedom in ANOVA
Understanding **degrees of freedom in ANOVA** is vital for evaluating variance between means. In a one-way ANOVA, degrees of freedom are calculated for between-group variability and within-group variability. The formula for between-group degrees of freedom is k – 1 (where k is the number of groups), and for within-group, it’s N – k (N being the total sample size). For example, if you have three groups with a total of 30 observations, the between-group degrees of freedom would be 3 – 1 = 2, and within-group would be 30 – 3 = 27. These calculations are crucial for **variance analysis**, ensuring a comprehensive assessment of group differences.
Common Misunderstandings and Mistakes
While learning about degrees of freedom, one might encounter various misconceptions. Understanding and correcting these can greatly enhance your statistical acumen.
Common Mistakes with Degrees of Freedom
One prevalent mistake is failing to subtract one from the sample size when calculating degrees of freedom for mean estimation, leading to underestimated variability. Additionally, confusion arises from not differentiating between what constitutes **degrees of freedom in statistics significance** compared to those used in regression or ANOVA contexts. It’s critical to apply the right formula based on the statistical test being conducted. Recognizing these common pitfalls is essential for effective statistical analysis.
Understanding the Relationship Between Sample Size and Degrees of Freedom
There is a directly proportional relationship between degrees of freedom and sample size. As sample size increases, so does the degrees of freedom, leading to more accurate and stable estimations. This means with larger samples, statistical results tend to become more reliable due to improved approximation of population parameters, thereby making the interpretation of **degrees of freedom impact on results** far clearer.
The Role of Degrees of Freedom in Hypothesis Testing
In hypothesis testing, the calculation and understanding of degrees of freedom provide critical insight into assessing the p-values that inform significant results. Here, df determines the rejection regions in hypothesis testing, helping researchers draw conclusions about null hypotheses. Effectively navigating these roles will enable better decision-making in statistical practices, ensuring your inferences are not only valid but actionable. Effective interpretation of **degrees of freedom in hypothesis tests** places you in a stronger position for analytical reasoning.
Key Takeaways
- Degrees of freedom represent the number of independent values capable of varying in calculations.
- Different statistical tests require distinct methods for calculating degrees of freedom.
- Common mistakes often arise from misconceptions surrounding these calculations.
- Understanding degrees of freedom is fundamental for accurate statistical inference, particularly in regression, ANOVA, and chi-square tests.
- Awareness of the relationship between sample size and degrees of freedom enhances decision-making accuracy.
FAQ
1. What is the degrees of freedom formula?
The degrees of freedom formula varies by test but is generally represented as (n – 1) for single-sample scenarios, (n1 + n2 – 2) for two-sample t-tests, and (k – 1) for the ANOVA between-group calculation. Accurate understanding ensures greater validity and reliability in statistical tests.
2. How are degrees of freedom affected by sample size?
As sample size increases, the degrees of freedom correspondingly increase, allowing for more accurate estimations of population parameters. This results in narrower confidence intervals and more statistically significant outcomes.
3. Why are degrees of freedom important in regression analysis?
In regression analysis, degrees of freedom are crucial for determining the model fit and estimating variance. They help assess the reliability of regression coefficients, affecting interpretations surrounding predictive relationships.
4. Can degrees of freedom be negative?
No, degrees of freedom cannot be negative. If calculations lead to a contradiction or negative value, it indicates an error such as miscounting the sample size or misunderstanding the test being performed. Always double-check calculations to ensure correctness.
5. How do I visualize degrees of freedom?
Degrees of freedom can be visualized through charts illustrating variance and confidence intervals or distribution curves. Tools like Excel or statistical software packages can effectively help depict these concepts graphically, thus simplifying the relationship between sample size and statistical testing.
6. What are degrees of freedom in relation to chi-square tests?
In chi-square tests, degrees of freedom are calculated using the formula (number of categories – 1) or (rows – 1)*(columns – 1) for contingency tables. These calculations guide researchers in assessing statistical significance in observed versus expected frequencies.
7. How can I feel comfortable with degrees of freedom?
Gaining comfort with degrees of freedom involves practice: work through various statistical problems and scenarios that require their calculation. Utilizing statistical software and consulting resources can also build confidence in the application and interpretation of degrees of freedom.